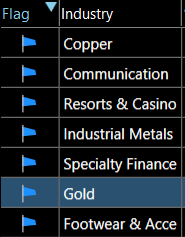
Hey, thay was the focus industry focus list from before the yesterdays open.
Gold was the play of the yesterday, other than that a quite consolidation day.
I had a discussion about the state of the market and that there will be a great opportunity to short it in the near future.
I am telling you this is anticipation of a trade and anticipation is dangerous.
Right now, we have the following:
10 MA > 20 MA on almost all industries, and all major indexes (including Germany EWG and EWG has a relative strength pattern to the SPY, that is extremely seldom).
Breakouts are working.
We had a two breath thrusts in the last weeks.
High beta Industry Groups behave very well (pulling back less than the SPY in the recent small pullback and > SPY).
Powell’s speech was not that hawkish, yet the market rallied.
Look, this is a bullish tape, not a bearish tone.
A bearish one would be if you flip the above and the glue will be if high beta industry groups start to be weaker than the SPY. And that flipping will take some time, it will not come overnight. Think about (I mean longer term trades, Intraday that is a different game) shorting when you clearly see a tape that fits, only think about the tape that is in front of you.
Remember, we do not have multibillion accounts. We can be in and out of the market fast, let’s use that!
Also, the best small cap value momentum systems (that incorporate industry momentum) are at all-time highs. Not all systems look like this, but still, the fact that these ones are strong means something (by the way, this is not a market for small cap momentum yet, midcaps show better follow through).
Here is the industry focus list for today. Not much to see because almost all IGs have rallied with the SPY and the SPY is so strong that most IGs could not outperform (not bearish, in this case it’s o.k. to play stocks without an IG relative strength pattern, if (!!!) IG > SPY, blue line > SPY!).
And here is a new layout (with the example of KLXE brekout at the time).
I will share the layout via a link for paying subscribers at the end of this post.
The above shows the example KLXE at the day of the first breakout.
What I want to see is the following:
Industry Group (Blue Line in the middle above white line) > SPY
Relative strength (red!) of the Stock > Industry Group
Relative strength line (white top) above price of the stock (means price is holding up much better than the price of the market)
Volume spikes before the breakout, volume at the breakout
Here you can see the setup for Gold two days ago, that was the reason why Gold was on the industry focus list:
Look at the chart and try to find the pattern.
IG > SPY
RS Line above Price
Volume spikes before
Now look at IAG (Gold stock) at the same day:
So, this is a buy candidate (not now it was).
· Stock is stronger than IG (Red line above blue line in the middle)
· White line above price (not much, the more the better!)
· Stock > 8 MA and was surfing it the whole way
· Uptrend and recent consolidation
Wait for the market to open and wait for the IG to pop and then take the trade in the stock. It was not a monster breakout, but we play breakouts and (!) momentum continuation. I went long IAG (unfort. with a small position, when Gold popped on that day).
If you then see SVIX (ETF that shorts one-month VIX Futures) puts in a relative strength at the same time (white line above price, meaning volatility likely to go down for the day), it’s a relative save trade.
Keep reading with a 7-day free trial
Subscribe to Trading for a sub 1 Million Account to keep reading this post and get 7 days of free access to the full post archives.


