Process:
I. Market
O.k. lets look at the tape:
Small Cap Value Momentum Systems with higher lows and relative strength in recent SPY and IWM pullbacks —> Yes
Recent breath thrusts —> Yes (11/22, 11/30)
10 MA > 20 MA: SPY, IWM, SMH, EWG (Germany with relative strength to SPY!!!), CHN (China, with relative strength to SPY!) —> Yes
Behav. of high beta industries (Biotech, Semis, Solar, Cycs.) —> very constructive (> SPY + in many cases pulling back less than SPY).
SVIX 0.00%↑ relative strength —> RS Line above the daily (good!)
All in all, very, very strong! We do not anticipate, we trade what is in front of us.
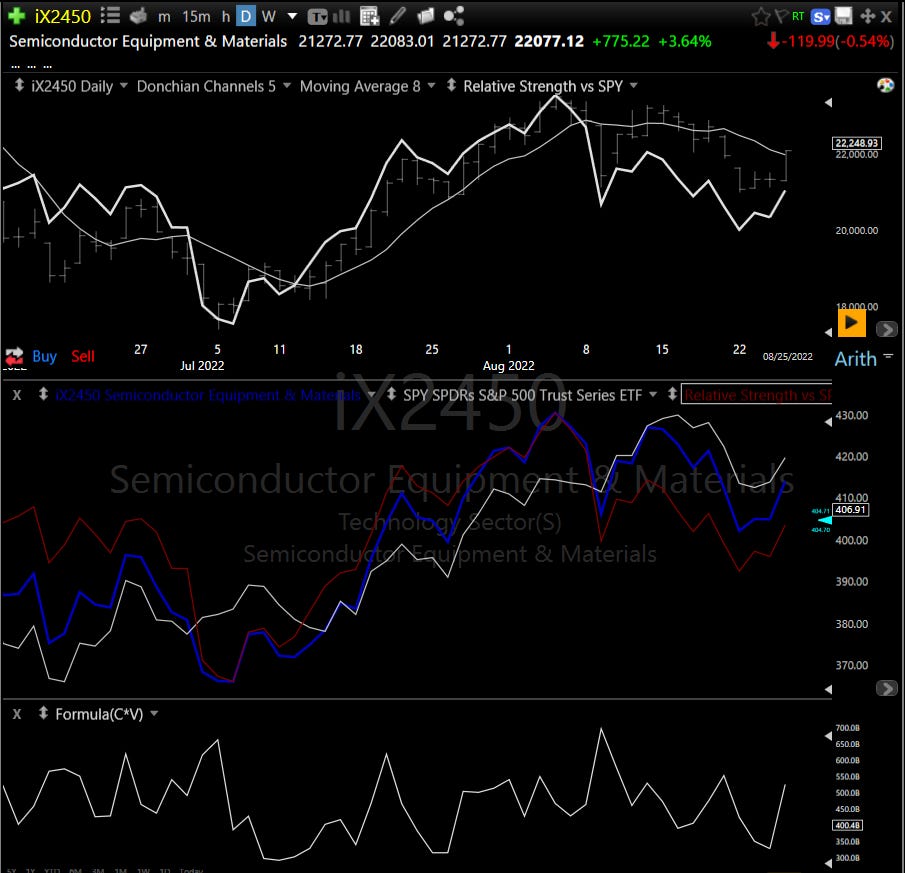
The differences to the top around 8/22/2022 are:
High beta industry groups where weak as hell (esp. Semis, all Tech IGs!), SVIX was weak (8/19, 8/26, 9/12), Germany was weak, China was weak. This is all not the case now!
What I mean with weak?
Here is an example around 8/22/2022 (basically every higher beta industry, China and Germany looked like this or even much weaker, and cyclicals like copper where in the abyss! This is not the case now, they (higher beta industries, Germany, China) look strong now!):
Look at the following chart ACLS 0.00%↑ 8/25/22. I took that breakout (I got out break even the next day).
But should I have taken that breakout. No! The industry group (blue line) was weaker than SPY and pulled back harder than SPY. And at the same time higher beta industry groups where already showing weakness (Semis at 08/25/22):
The IG (blue line) < SPY and pulled back harder than SPY. No take!
So, know look at ACLS 0.00%↑ when the industry group was strong:
That one was takeable! (IG (blue line) > SPY, IG putting in relative strength pattern: Pulling back less than SPY!).
When high beta industries show strength in a pullback: Time to press (hard to do because the pullback within the SPY scares and fintwit tells you this is the end of the world (one of my biggest weaknesses!).
Yes, there are stocks that defy the Industry Group and the Market. But this is not my game!
II. Industry Groups
We did not have a pullback, so not much to see on the industry group front, most rallied strongly with the SPY, that is good, but we need a pullback to see what is strong from there.
But you can see constructive rotation, semis have been weak yesterday (one day!), but Solar rallied, this is fine!
III. Stocks
Based on a Portfolio123.com screen
FRank("Close(0)/Close(20)",#Industry,#DESC) > 70 or FRank("Close(0)/Close(20)",#subIndustry,#DESC) > 70 or FRank("Close(0)/Close(8)",#SubIndustry,#DESC) > 80 or FRank("Close(0)/Close(8)",#subIndustry,#DESC) > 80
AvgDailyTot(20) > 300000
The screen picks stocks out of the top 30% industry groups or Top 20% Sub Industry Groups.
I then filter the stock list in TC2000 with relative strength and volume spikes (could do it also in P123, but if I have time I go through all of them without a relative strength filter in order to catch something like MANU 0.00%↑ (flat base for long so no relative strength recently).
I then go through the list and flag interesting charts:
Keep reading with a 7-day free trial
Subscribe to Trading for a sub 1 Million Account to keep reading this post and get 7 days of free access to the full post archives.


