Market
Nothing changed, the rally got sold hard on the better-than-expected CPI Report and we had a decent reaction to the 0.5% increase of the fed.
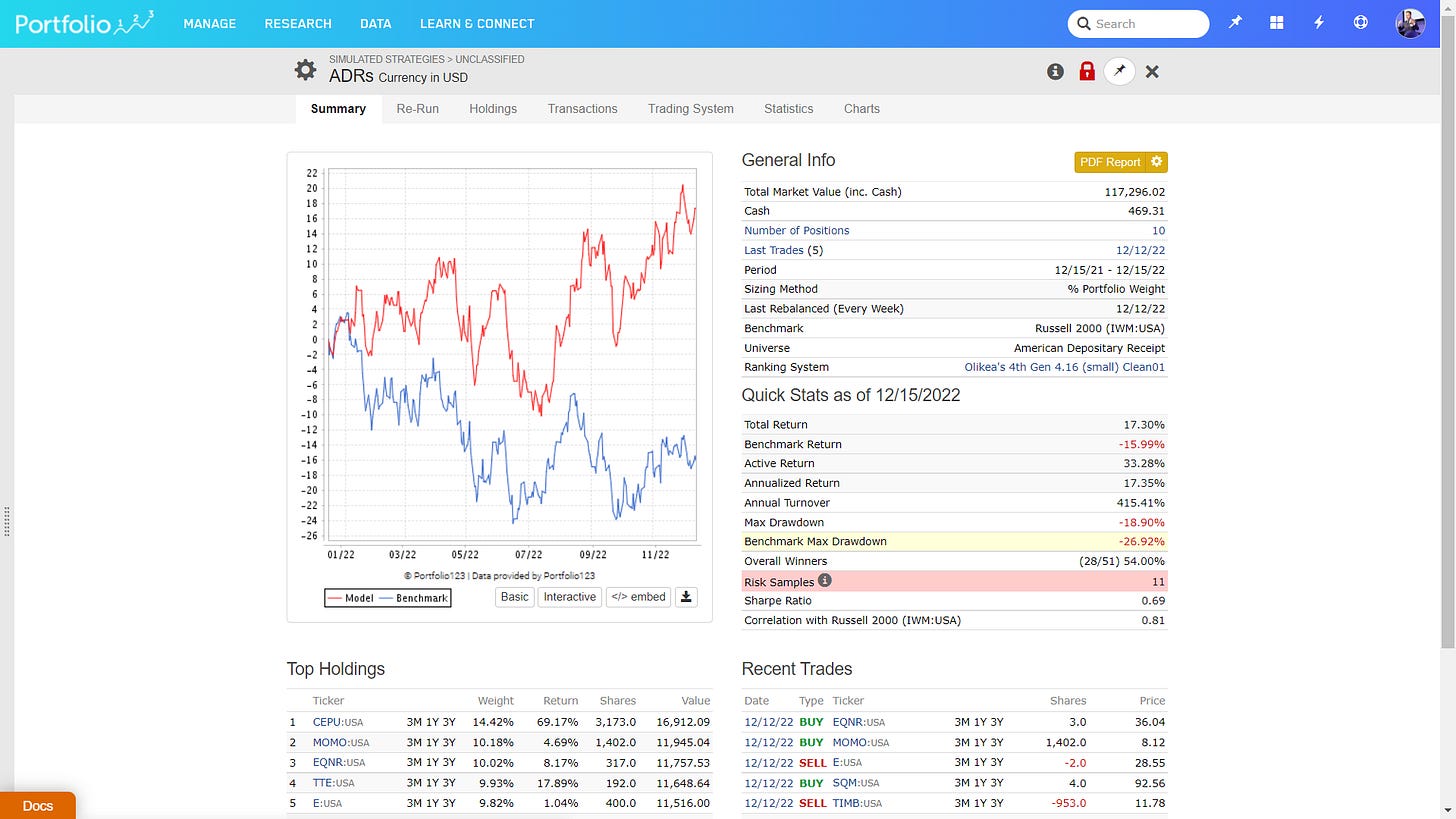
International > USA right now:
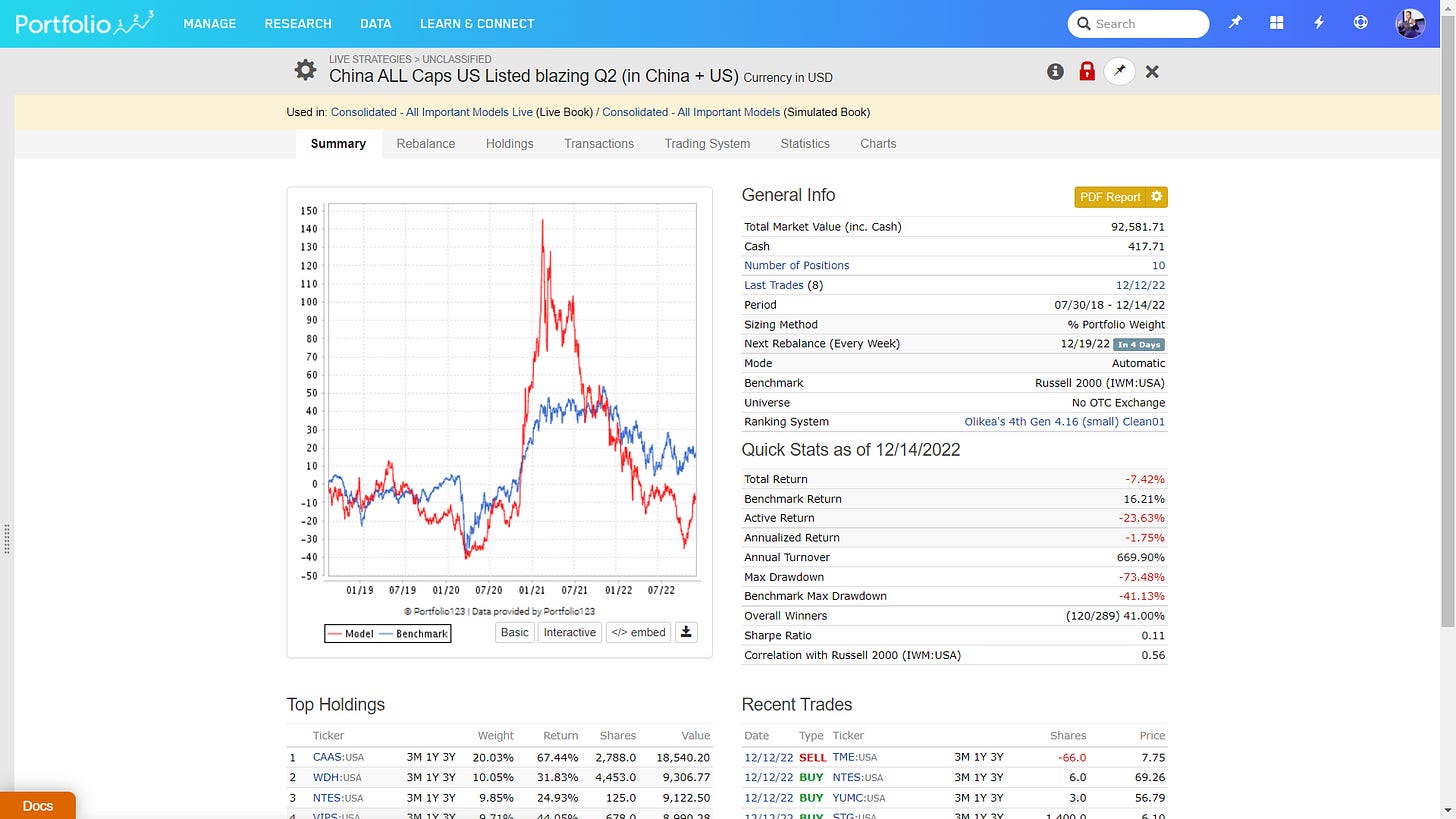
China stronger, if that sucker bases from here in a flag and then goes on up hell will break loose (on the long side for China stocks):
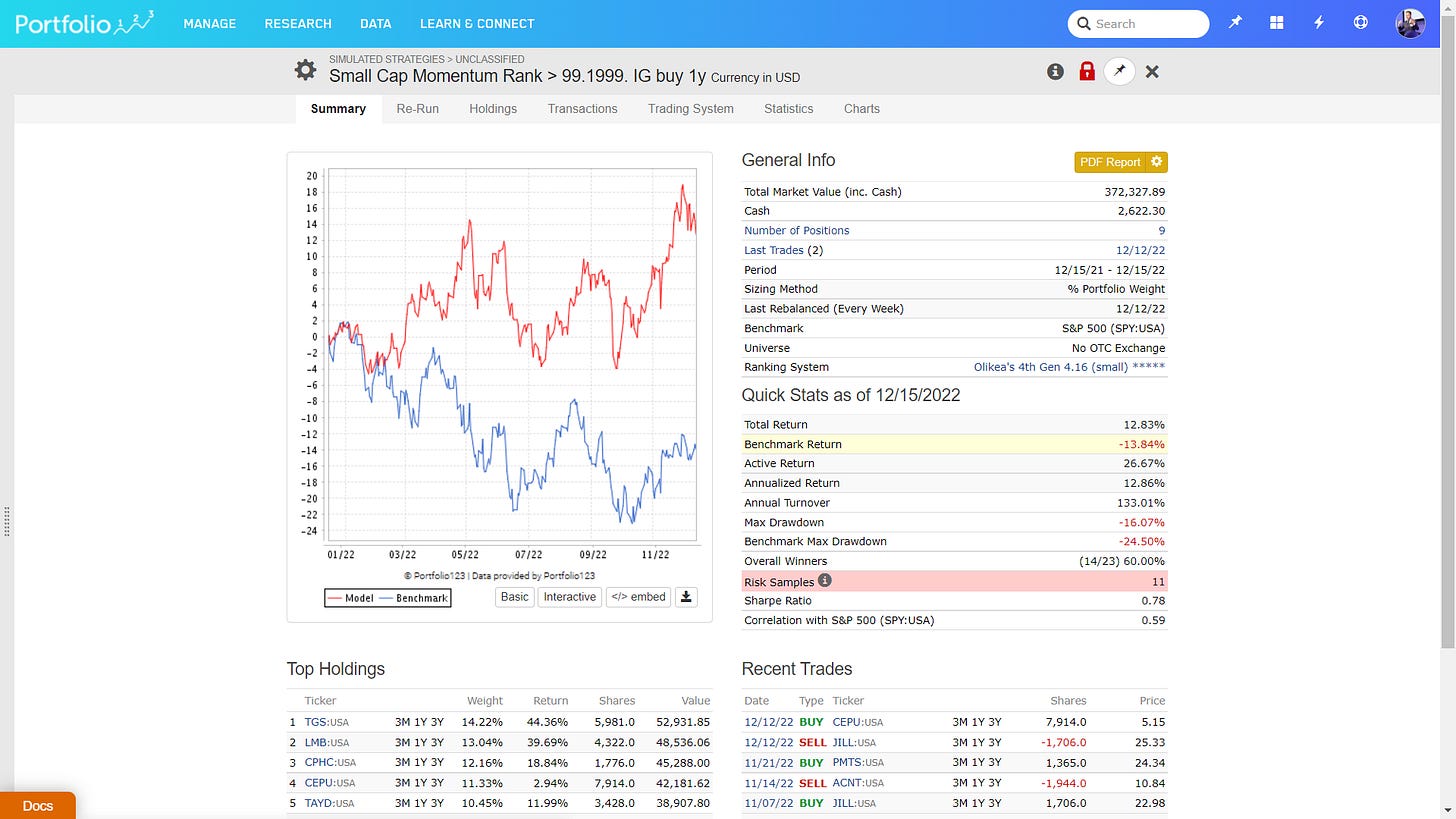
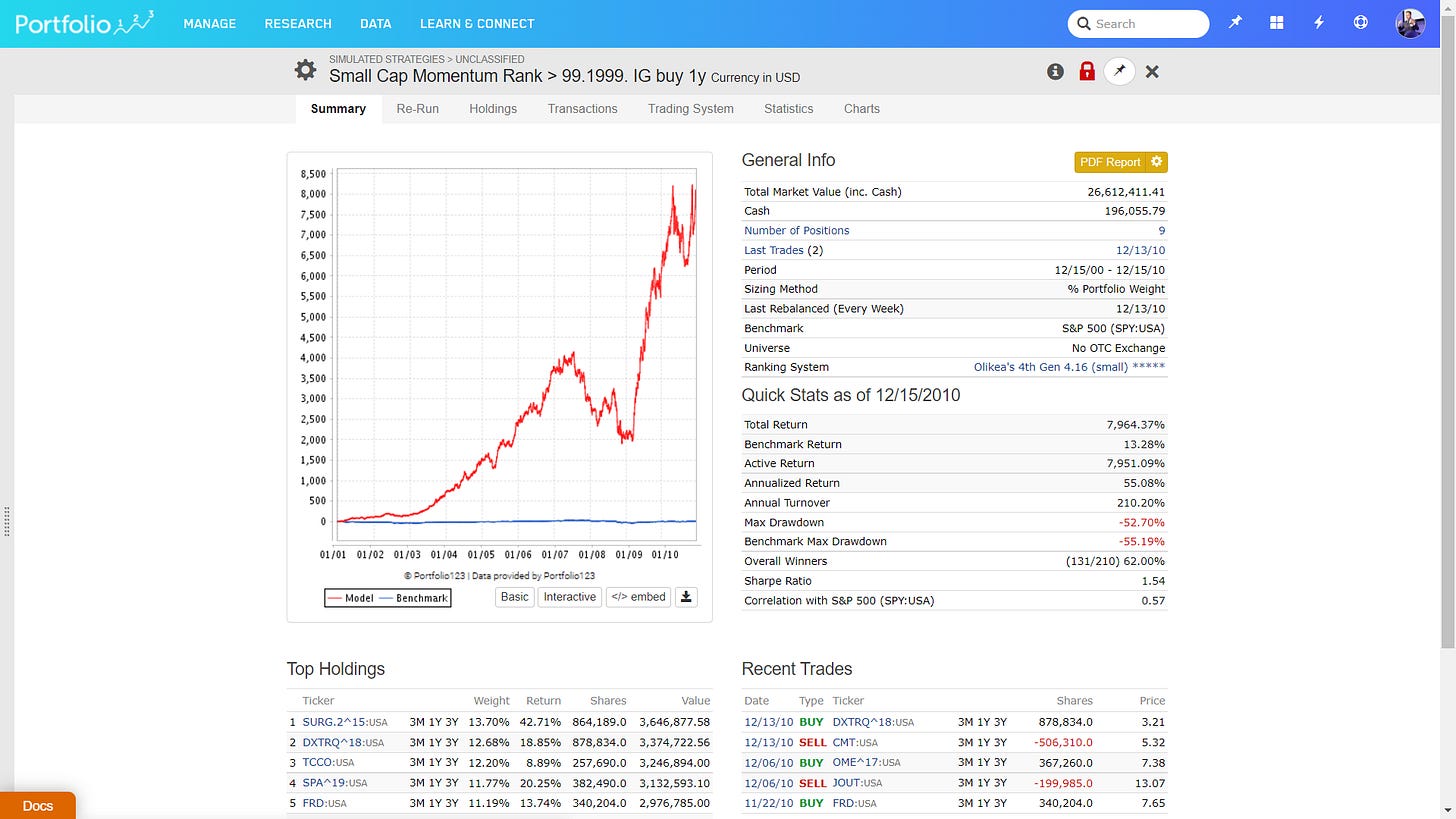
Small cap value momentum (within strong industry groups). Hanging in there. If that thing makes an all-time high, that would be bullish.
Still, this is a highly correlated market with no strong relative strength of higher beta industry groups.
The main themes are China and Biotech stocks and a lot of rallies in lower priced stocks.
It feels a bit like 2002, which was a stealth bull market building and a tech and big cap bear market.
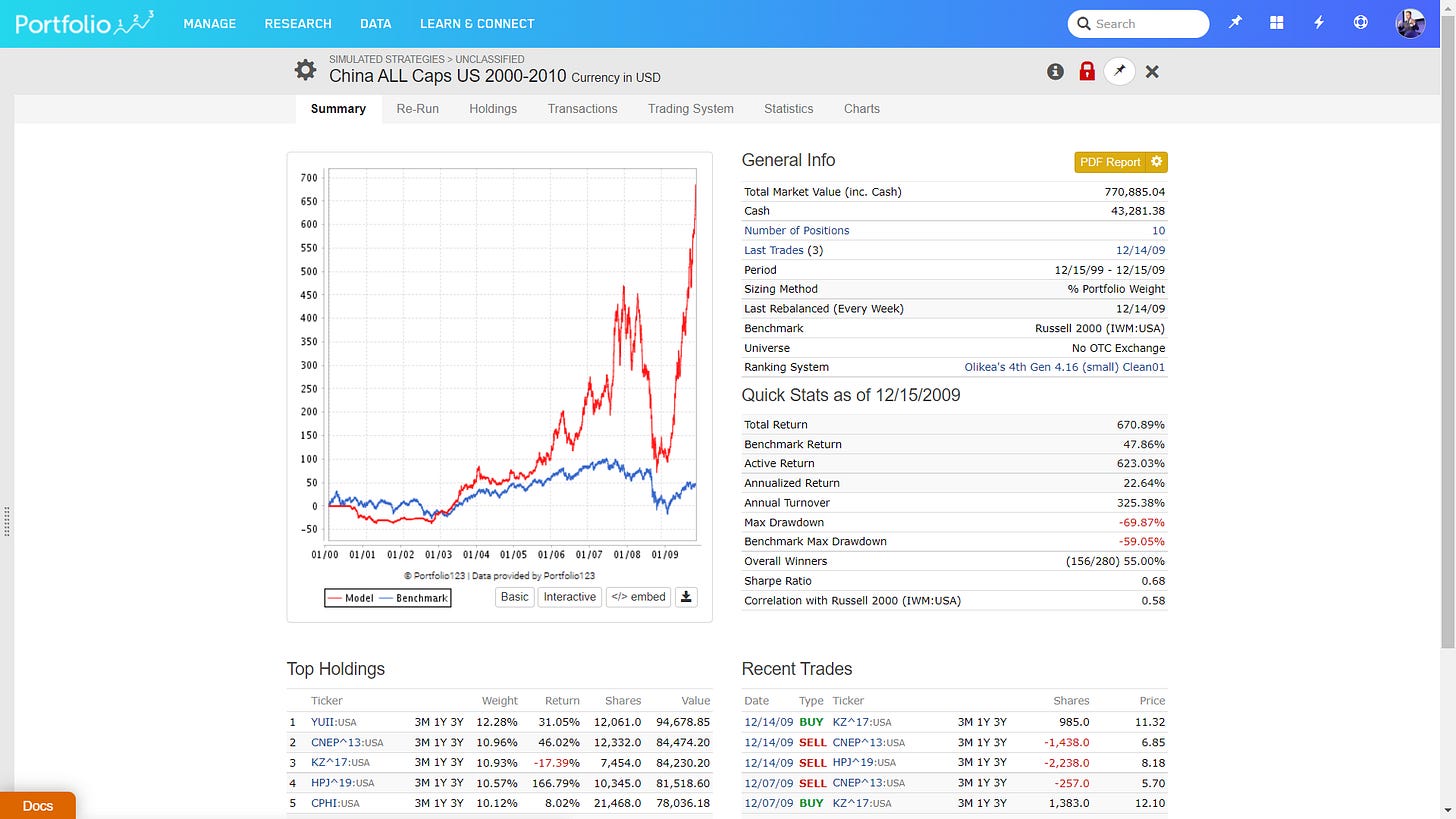
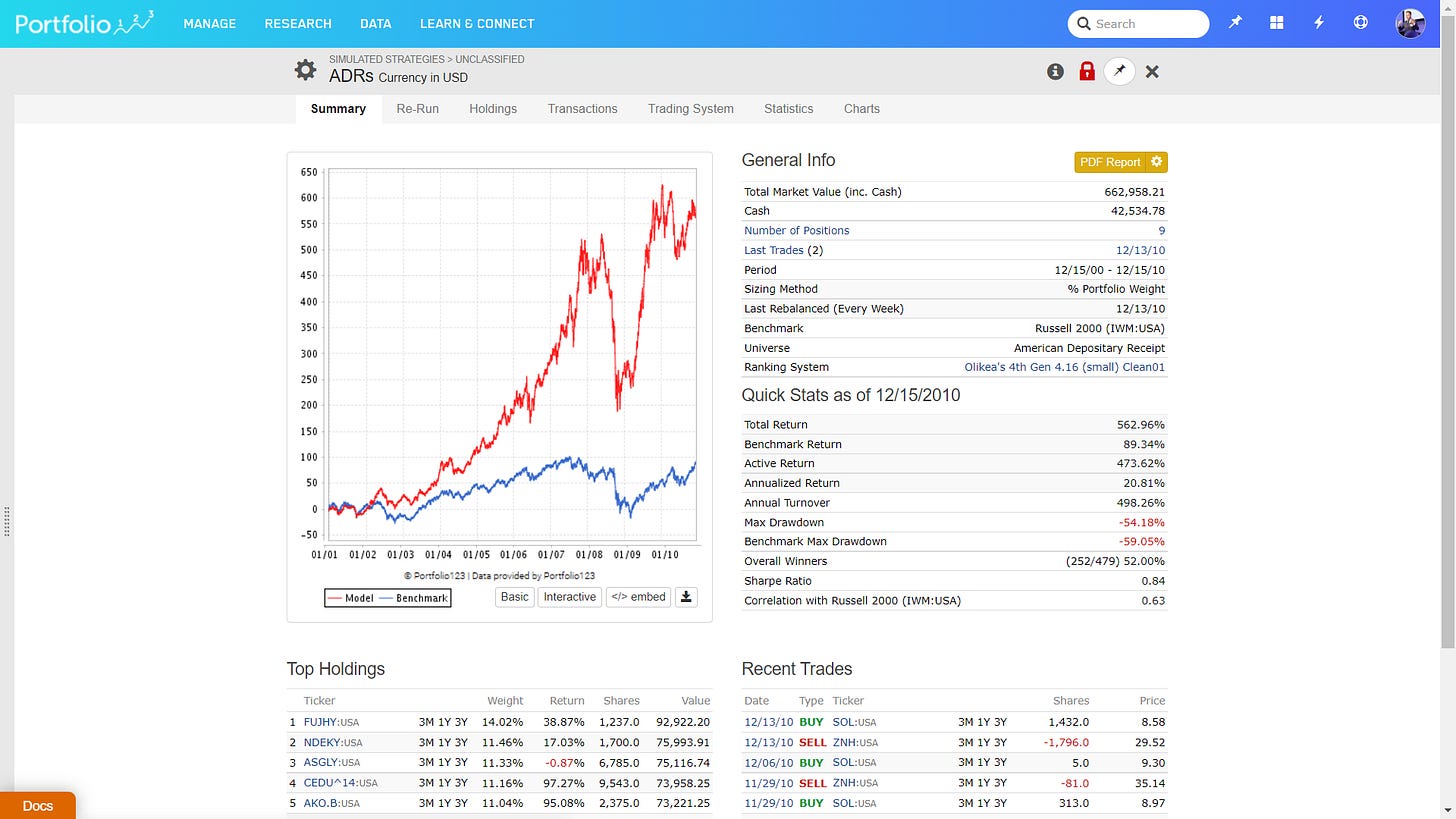
China > US from 2000-2010:
International > US from 2000-2010 (now the same relative strength of international stocks like in 2002!)
Small cap value momentum from 2000-2010 (we see almost the same strength now (though very volatile) as in 2002):
What I am trying to say here: Better times are on the way!
Here is a list of all China ADRs:
AACG ADAG AEHL AIH AIHS AIU AMBO ANPC ANTE API ATAT ATHM ATIF ATXG BABA BAOS BEDU BEKE BEST BHAT BIDU BILI BIMI BNR BON BQ BRLI BTB BTOG BZ BZUN CAAS CAN CANG CBAT CCM CCNC CD CEA CGA CIH CJJD CLEU CMCM CNET CNEY CNF CNTB CPHI CPOP CREG DADA DAO DDL DOGZ DOYU DQ DSWL DTSS DUO DXF EBON EDTK EDU EH EJH EM EPOW EVK EZGO FAMI FANH FEDU FENG FFHL FINV FLJ GDS GEHI GGE GHG GLG GOTU GRCL GRCY GSMG GSUN GTH GURE HAPP HMAC HOLI HTHT HUDI HUIZ HUYA HYW IFBD IH IMAB IQ ITP JD JFIN JFU JG JKS JT JWEL JXJT JZ JZXN KC KNDI KRKR KUKE KXIN LEJU LI LITB LIZI LKCO LU LX LXEH MDJH METX MF MFH MHUA MNSO MOGU MOMO MOXC MTC NA NAAS NCTY NIO NISN NIU NOAH NTES OCFT OG OST PBTS PDD PETZ PHCF PME PT PUYI QD QFIN QH QLI QTT RAYA RCON RERE RETO RLX SECO SEED SISI SJ SNTG SOHU SOS SPK STG SXTC SY TAL TANH TC TCOM TEDU THCH TIRX TME TOUR TUYA UK UPC UTME UTSI UXIN VIOT VIPS VNET WAFU WB WDH WETG WIMI WNW XIN XNET XPEV XYF YGMZ YI YJ YMM YQ YRD YSG YUMC ZCMD ZEPP ZH ZKIN ZLAB ZNH ZTO
Until next earning season, we are likely to drift sideways. If we are lucky the China and Biotech theme and lower priced stocks rallies goes on in the meanwhile.
Chart Template
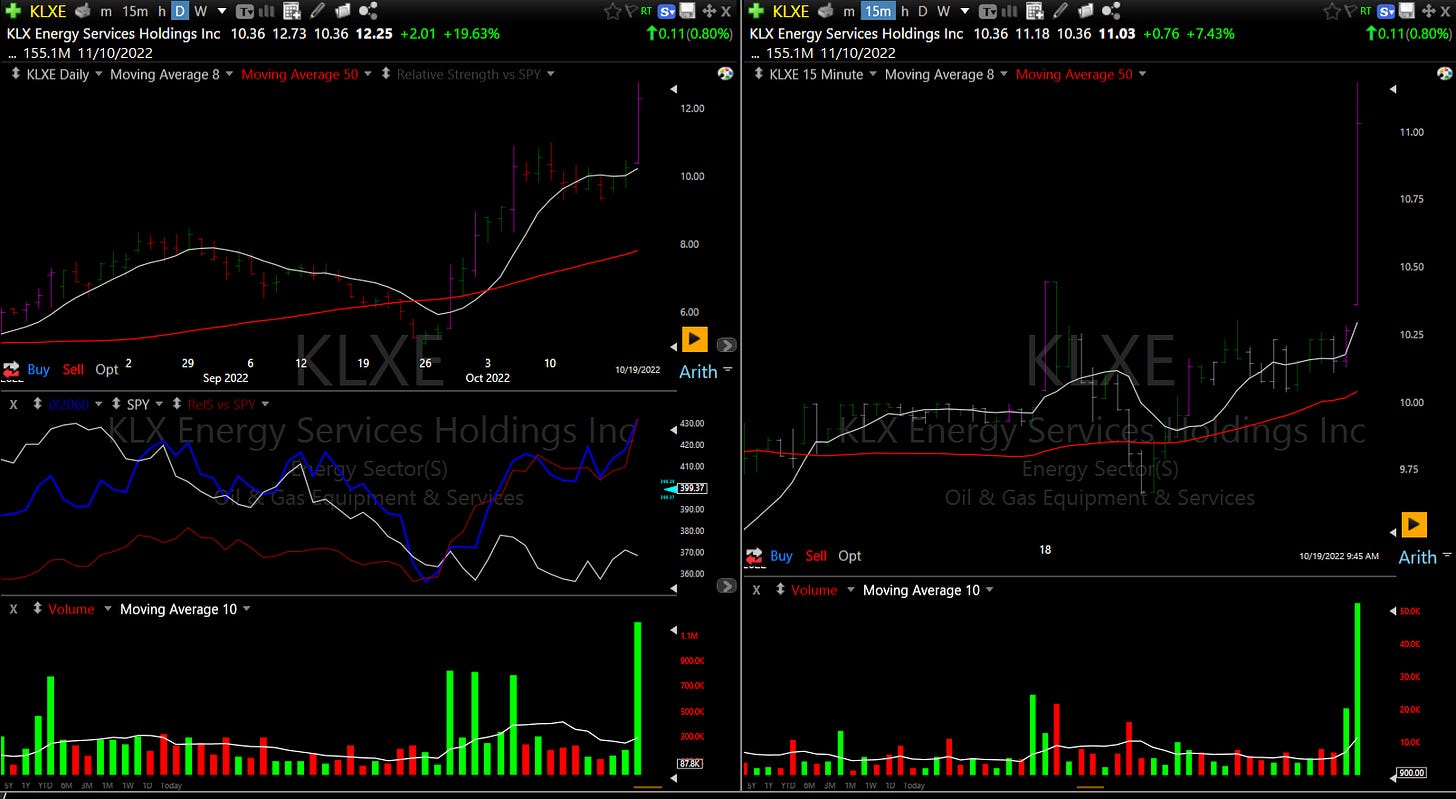
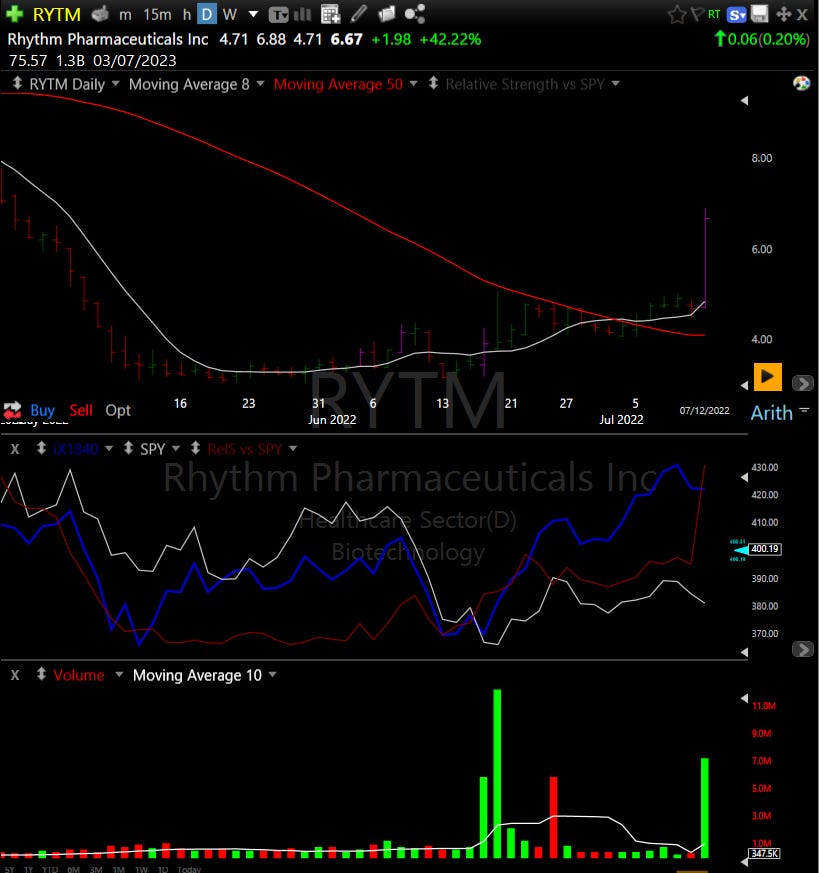
I improved my chart template:
First of all, Volume.
Second (in the middle right) the SPY (white), the Industry Group (blue) and the relative strength of the stock (red).
In the main chart section are some of the days of the chart in pink: this is a range expansion (with volume!!!), e.g., a hint that the stock is breaking out.
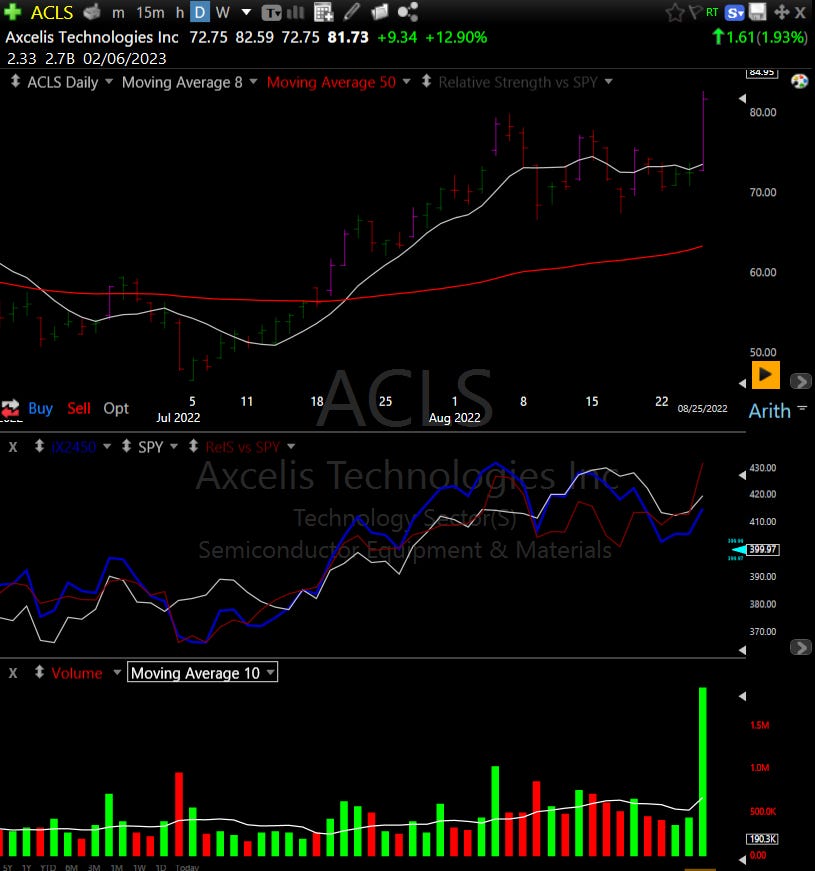
Now let us look at ACLS (this breakout failed):
I took this breakout (got out around breakeven). Why not take this breakout?
The base was a bit choppy, and the main reason is the industry group (blue line in the middle) lost its relative strength to the market (SPY: white line in the middle).
But volume was really good, so no crime to take it, just really important to manage it!
Now RYTM (that one worked!).
It has everything lined up:
Long term reversal.
Price Spike and holding the low of that price spike.
Volume Spikes before.
And most important: look at the space between the IG (Biotech in blue) and SPY.
A huge positive divergence.
The 8-moving average catches up (white line in the chart), that makes sure, the price is not overextended!
Combine that with big volume and you got a trade.
But how (took me a while to get this!):
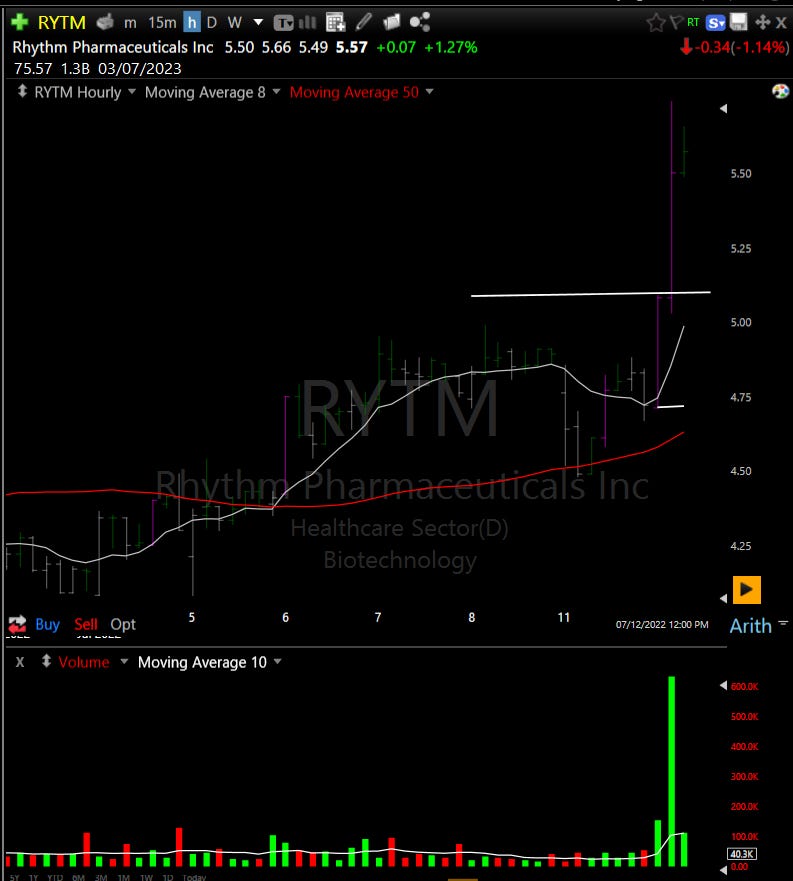
The above is the hourly (I cannot go back that far with the 15 Min. too much history for TC2000 ;-)).
I usually use the 15 min.; the logic is the same.
So, the buy is on the break of the hourly.
The Stop Loss is on the low of that breakout candle, around 8.5%.
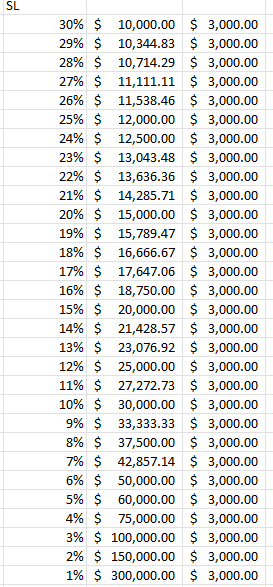
Now you got your position size. Figure out how much you want to lose maximum on a trade. With me right now it is 3k.
So, a position around 33k.
I build me a little table with excel:
I printed it out. In the heat of the trade, I do want to have the optimal position size!
The key is: Would I take this trade if I would need a 20% Stop loss.
Yes! But then the position size would be 15k. Do not fear volatility, just adjust the bet size.
You get the logic!
So what is important:
Prepare you watchlist for the day or design a good breakout scanner on TC2000.
I have about 15. min to see it and wait until the range expansion is there!
Now when to sell?
First of all, respect your stop.
Second: Depending on the market let the 10 moving average or the 20 moving average your guide.
So, in a raging bull market (after a deep bear), give you positions as much room as possible, so take the 20-day moving average. Sell if it closes below (at the end of the day).
Also, what then risk is different. I might go with bigger positions (risking 10k instead of 3k). But know before each trading week / month how much you want to risk per trade.
Do not vary your position size (besides based on your stop!). You will end up having your biggest losers in bigger and your biggest winners in small positions (at least I do, lol).
Furthermore, a lot of successful swing traders sell 50% of the position 3-5 days into the trade and let the rest trail by the 10- or 20-day moving average.
In a good market there is one wave of breakouts after another. The first 3-5 days are the strongest, so therefore you can rotate your money into new breakouts if you sell 50% in 3-5 days.
This is it; this is swing trading with a template helping to see the breakout, the volume and the strength of the industry group.
There will be another post base on the pink “breakout candles”.
What happens very ofthen is that price pulls back into the breakout candle. That is not nessesarly bearish, it can be a good buy point. This subject is for another post.
Here is the chart template for TC2000:
Keep reading with a 7-day free trial
Subscribe to Trading for a sub 1 Million Account to keep reading this post and get 7 days of free access to the full post archives.


